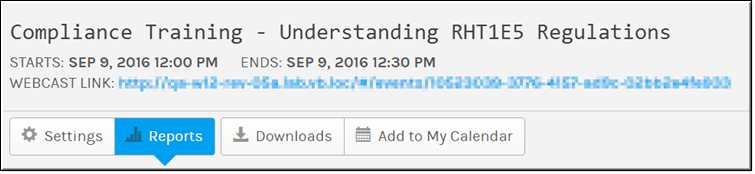
Event Reports
Event Analytics and Quality of Experience Reports
Event and Account Admins may access the once the event has ended.

To access and download event analytics reports/metrics:
1. Navigate to > > >
2. Click the button to access and tabs.
3. The button also contains links to download the , , , and reports.
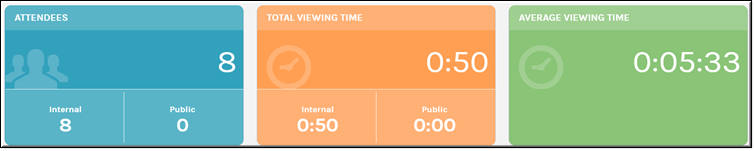
The tab displays the following information.
●Total number of Attendees (internal versus public)
●Total Viewing Time (internal versus public)
●Average Viewing Time
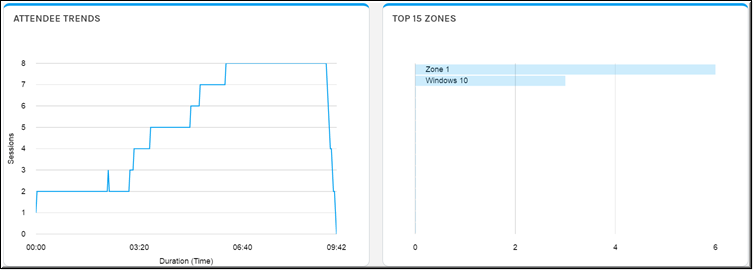
●Attendee Trends (sessions by time/duration). View how many attendees/sessions are connected to the event at any given time. This allows you to see when people connect/drop-off.
●Top 15 Zones used to connect to the event.
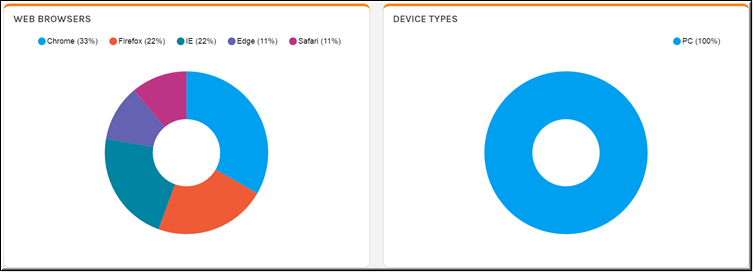
●Web Browsers used
●Device Types used
The tab displays the following information.
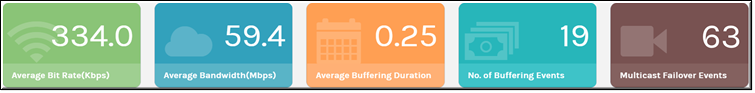
●Average Bit Rate Kbps (for all attendees)
●Average Bandwidth Mbps (for all attendees)
●Average Buffering Duration (in seconds)
●Number of Buffering Events that occurred
●Multicast (to Unicast) Failover Events that occurred
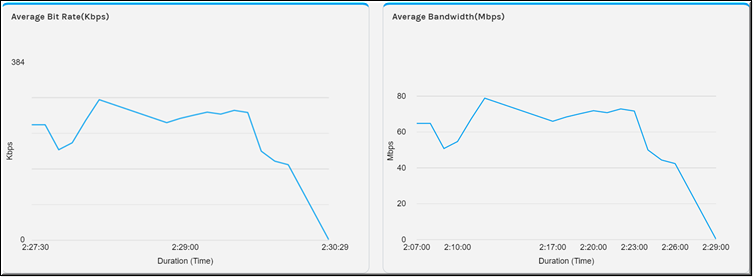
●Average Bit Rate (by event time)
●Average Bandwidth (by event time)
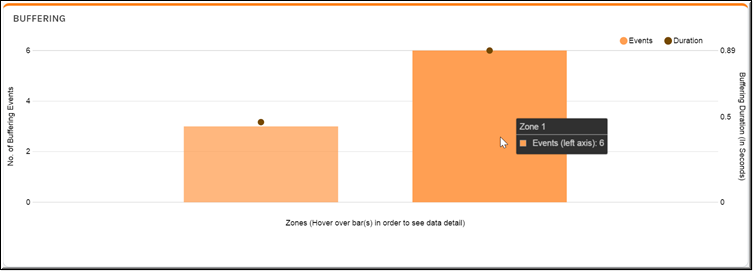
●Buffering events
●Bars represent the total number of buffering events by zone
●Dot on each bar represents buffering duration
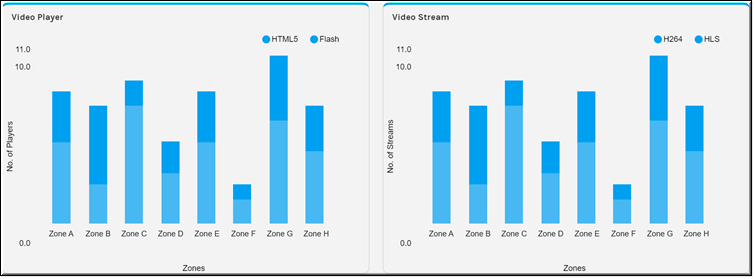
●Video Player (type used and numbers by zone)
●Video Stream (type and number of streams by zone)
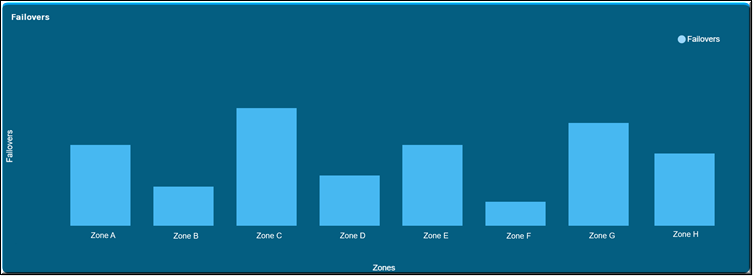
●Failovers (multicast to unicast) experienced by zone
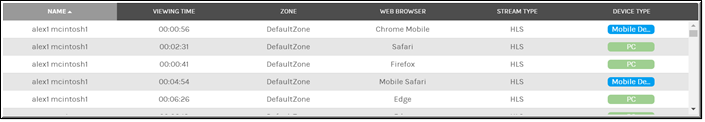
The tab displays the following information.
●Name (First Name, Last Name)
●Viewing Time (Total time in Webcast)
●Zone
●Web browser used (Safari, IE, Chrome, Edge, Mobile browsers specified)
●Stream Type
●Device Type (Mobile / PC)
●The Find User search bar may be used to find a specific user.